You may have heard it takes more resources to produce animal products than vegetable products—but the actual environmental impact depends on a number of things. The cost of food isn’t limited to what you see on the label. A lot has to happen in order to get it from the farms where it’s grown to the grocery stores where you shop. All of these steps produce greenhouse gas emissions that contribute to climate change. Carbon dioxide (CO2) emissions are particularly harmful—that’s why “carbon footprint” is used to talk about environmental impact. To calculate this, scientists ask questions like these:
- How much land had to be cleared to grow a certain crop?
- How far did the food have to travel to get to your grocer?
- How sustainable were the processes required to grow it?
And when you’re concerned about the environmental effect of the food you choose to buy, they’re important for you to consider as well.
An imported vegetable grown in a wasteful irrigation system could have a larger footprint than sustainably raised, local meat. According to experts, shifting to vegetarian or vegan diets isn’t an ideal solution to climate issues. And meat is a source of protein, vitamins, and minerals that make it a nutritious part of your diet.
The key is to choose responsibly sourced, protein-rich meat with a lower carbon footprint. Poultry products such as turkey fit the bill perfectly. And you can swap them in to replace less sustainable products. Godshall’s is committed to sustainable practices—including increasing our use of solar energy, ensuring waste stays out of landfills, reducing our water consumption, and reducing CO2 emissions with natural gas ovens and by recycling heat.
Check out our infographic to see how turkey stacks up against six popular animal proteins. A lot of the time, a food’s carbon footprint is measured in kilograms—much larger than your typical meal. You may also see CO2 emissions calculated per year, instead of per plateful. We’re simplifying it by showing you the carbon footprint and CO2 emissions of a single serving in ounces.
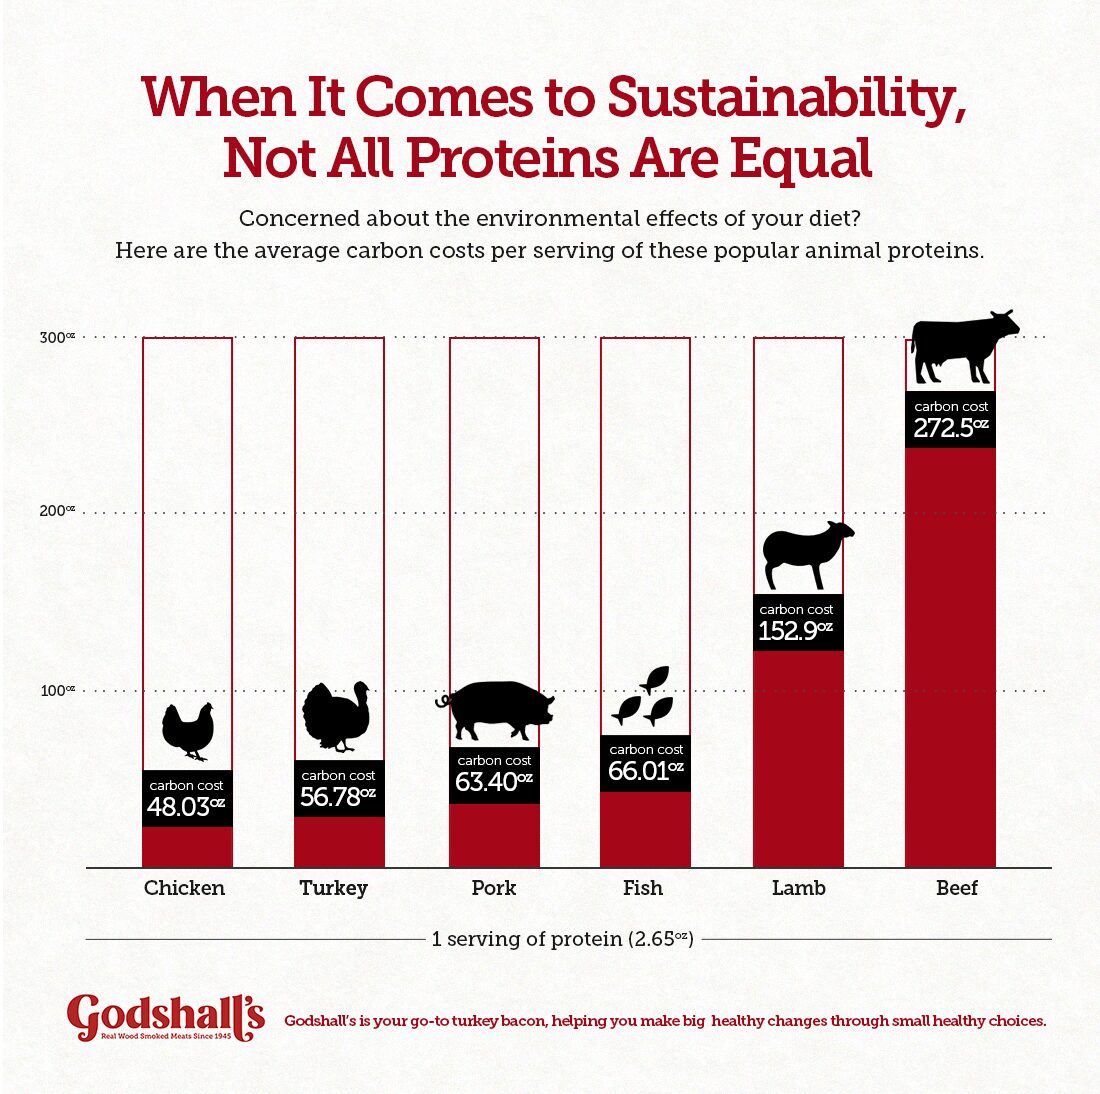
*We based our calculations on modeling done by the BBC, using research from the University of Oxford and the Agroecology and Environment Research Division. So all carbon footprints are derived from an analysis of global averages, and standard serving sizes have been determined by dieticians.
**Turkey isn’t analyzed in the BBC’s model, but according to Consumer Ecology, it’s 4.8x smaller than beef, and Green Eatz calculates that it’s more energy-intensive than chicken, but less energy-intensive than pork. With this information, we determined what its approximate carbon footprint would be.